Linear, RF, XGB, LGB를 이용한 아파트 에너지 사용량 예측 모델링
추후 참고용으로 올리는 energy consumption
Configuration
Install Libraries
!pip install natsort
!pip install pytictoc
!pip install pymysql
!pip install lightgbm
!pip install xgboost
!pip install pytictoc
Collecting natsort
Downloading natsort-8.0.0-py3-none-any.whl (37 kB)
Installing collected packages: natsort
Successfully installed natsort-8.0.0
[33mWARNING: You are using pip version 21.2.4; however, version 21.3.1 is available.
You should consider upgrading via the '/home/ec2-user/anaconda3/envs/python3/bin/python -m pip install --upgrade pip' command.[0m
Collecting pytictoc
Downloading pytictoc-1.5.2-py2.py3-none-any.whl (4.0 kB)
Installing collected packages: pytictoc
Successfully installed pytictoc-1.5.2
[33mWARNING: You are using pip version 21.2.4; however, version 21.3.1 is available.
You should consider upgrading via the '/home/ec2-user/anaconda3/envs/python3/bin/python -m pip install --upgrade pip' command.[0m
Collecting pymysql
Downloading PyMySQL-1.0.2-py3-none-any.whl (43 kB)
[K |████████████████████████████████| 43 kB 1.1 MB/s eta 0:00:01
[?25hInstalling collected packages: pymysql
Successfully installed pymysql-1.0.2
[33mWARNING: You are using pip version 21.2.4; however, version 21.3.1 is available.
You should consider upgrading via the '/home/ec2-user/anaconda3/envs/python3/bin/python -m pip install --upgrade pip' command.[0m
Collecting lightgbm
Downloading lightgbm-3.3.1-py3-none-manylinux1_x86_64.whl (2.0 MB)
[K |████████████████████████████████| 2.0 MB 1.7 MB/s eta 0:00:01
[?25hRequirement already satisfied: numpy in /home/ec2-user/anaconda3/envs/python3/lib/python3.6/site-packages (from lightgbm) (1.19.5)
Requirement already satisfied: wheel in /home/ec2-user/anaconda3/envs/python3/lib/python3.6/site-packages (from lightgbm) (0.36.2)
Requirement already satisfied: scikit-learn!=0.22.0 in /home/ec2-user/anaconda3/envs/python3/lib/python3.6/site-packages (from lightgbm) (0.24.1)
Requirement already satisfied: scipy in /home/ec2-user/anaconda3/envs/python3/lib/python3.6/site-packages (from lightgbm) (1.5.3)
Requirement already satisfied: joblib>=0.11 in /home/ec2-user/anaconda3/envs/python3/lib/python3.6/site-packages (from scikit-learn!=0.22.0->lightgbm) (1.0.1)
Requirement already satisfied: threadpoolctl>=2.0.0 in /home/ec2-user/anaconda3/envs/python3/lib/python3.6/site-packages (from scikit-learn!=0.22.0->lightgbm) (2.1.0)
Installing collected packages: lightgbm
Successfully installed lightgbm-3.3.1
[33mWARNING: You are using pip version 21.2.4; however, version 21.3.1 is available.
You should consider upgrading via the '/home/ec2-user/anaconda3/envs/python3/bin/python -m pip install --upgrade pip' command.[0m
Collecting xgboost
Downloading xgboost-1.5.1-py3-none-manylinux2014_x86_64.whl (173.5 MB)
[K |████████████████████████████████| 173.5 MB 15 kB/s /s eta 0:00:01 |█████████████████████████████▉ | 161.8 MB 153.1 MB/s eta 0:00:01
[?25hRequirement already satisfied: numpy in /home/ec2-user/anaconda3/envs/python3/lib/python3.6/site-packages (from xgboost) (1.19.5)
Requirement already satisfied: scipy in /home/ec2-user/anaconda3/envs/python3/lib/python3.6/site-packages (from xgboost) (1.5.3)
Installing collected packages: xgboost
Successfully installed xgboost-1.5.1
[33mWARNING: You are using pip version 21.2.4; however, version 21.3.1 is available.
You should consider upgrading via the '/home/ec2-user/anaconda3/envs/python3/bin/python -m pip install --upgrade pip' command.[0m
Requirement already satisfied: pytictoc in /home/ec2-user/anaconda3/envs/python3/lib/python3.6/site-packages (1.5.2)
[33mWARNING: You are using pip version 21.2.4; however, version 21.3.1 is available.
You should consider upgrading via the '/home/ec2-user/anaconda3/envs/python3/bin/python -m pip install --upgrade pip' command.[0m
import gc, sys, os, warnings
import pandas as pd
import numpy as np
from datetime import date,datetime
from natsort import natsorted
from scipy import stats
from pytictoc import TicToc
import datetime
from sklearn.linear_model import LinearRegression, Ridge, Lasso, ElasticNet
from sklearn.svm import LinearSVR, SVR
from sklearn.model_selection import GridSearchCV, KFold
from sklearn.tree import DecisionTreeRegressor
from sklearn.ensemble import RandomForestRegressor
from xgboost import XGBRegressor
from lightgbm import LGBMRegressor
from sklearn.model_selection import train_test_split
from sklearn.preprocessing import MinMaxScaler
import pickle, joblib


os.getcwd() # working directory check
gc.collect() # garbage collect
warnings.filterwarnings('ignore')# 경고 출력하지 않음 -----------

# scipen 제거
pd.options.display.float_format = '{:.2f}'.format

#library versions
print('Pandas:', pd.__version__)
print('Numpy:', np.__version__)
Pandas: 1.1.5
Numpy: 1.19.5
Data Connection
# mysql connector를 사용하기 위한 모듈 선언
import pymysql

# mysql connection을 선언한다.
#파라미터는 host는 접속 주소, user는 ID, passwd는 패스워드, database는 접속할 데이터 베이스이다.
conn = pymysql.connect(host="hostip",
                       user="user", passwd="password",
                       db='database',
                       charset='utf8')
Pickle Read and Write function
# Pickle Read and Write function

import boto3
from io import BytesIO

def write_joblib(file, path):
    # Path is an s3 bucket
    if path[:5] == 's3://':
        s3_bucket, s3_key = path.split('/')[2], path.split('/')[3:]
        s3_key = '/'.join(s3_key)
        with BytesIO() as f:
            joblib.dump(file, f)
            f.seek(0)
            boto3.client("s3").upload_fileobj(Bucket=s3_bucket, Key=s3_key, Fileobj=f)
    # Path is a local directory
    else:
        with open(path, 'wb') as f:
            joblib.dump(file, f)

def read_joblib(path):
    # Path is an s3 bucket
    if path[:5] == 's3://':
        s3_bucket, s3_key = path.split('/')[2], path.split('/')[3:]
        s3_key = '/'.join(s3_key)
        with BytesIO() as f:
            boto3.client("s3").download_fileobj(Bucket=s3_bucket, Key=s3_key, Fileobj=f)
            f.seek(0)
            file = joblib.load(f)
    # Path is a local directory
    else:
        with open(path, 'rb') as f:
            file = joblib.load(f)

    return file
Data Load
Load DB data
t = TicToc()
t.tic()  # 시작 시간

Day_Energy = pd.read_sql_query('select ENERGY_YEAR,ENERGY_MONTH,ENERGY_DAY,DONG,HO,ENERGY_USE01 from dayenergy',conn)\
.assign(ENERGY_YEAR= lambda x: x['ENERGY_YEAR'].astype('str'),
        ENERGY_MONTH= lambda x: x['ENERGY_MONTH'].astype('str'),
        ENERGY_DAY= lambda x: x['ENERGY_DAY'].astype('str'),
        DONG=lambda x: x['DONG'].astype('str'),
        HO=lambda x: x['HO'].astype('str'),
        ENERGY_USE01=lambda x: x['ENERGY_USE01'].astype('float'))\
.rename(columns={'ENERGY_YEAR' : 'year', 'ENERGY_MONTH' : 'month', 'ENERGY_DAY' : 'day',
                 'DONG' : 'dong','HO' : 'ho','ENERGY_USE01' : 'power'})

Day_Energy['date']= pd.to_datetime(Day_Energy['year']+'-'+Day_Energy['month']+'-'+Day_Energy['day'],format='%Y-%m-%d')
Day_Energy['week']= pd.to_datetime(Day_Energy['date']).dt.day_name()
Condition1=Day_Energy['week'].isin(['saturday','sunday'])
Day_Energy.loc[:,'weekend']=0
Day_Energy.loc[Condition1,'weekend']=1

Day_Energy['dongho']=  Day_Energy['dong']+'-'+Day_Energy['ho']
Day_Energy["floor"]=Day_Energy["ho"].str[:-2]

Day_Energy=Day_Energy.sort_values(by=['date','dongho'], axis=0)

# 세대 유형(평형) 추가
Day_Energy.loc[:,'type']='34Py'
Condition1= Day_Energy['dongho'].isin(['805_2803','806_2903','808_2809'])
Condition2= Day_Energy['dong'].isin(['811','812'])
Day_Energy.loc[Condition1,'type']='45Py'
Day_Energy.loc[Condition2,'type']='Private 36Py'

# 에너지 사용량 상하한 기준 값(하한 0이상, 상한 70)
Day_Energy=Day_Energy.assign(power= lambda x: x['power'].clip(0,70))

Day_Energy= Day_Energy.drop(['year','month','day','dong','ho' ],axis=1)
Day_Energy['date']=Day_Energy['date'].astype('str')

Day_Energy['date']=pd.to_datetime(Day_Energy['date'],format='%Y-%m-%d')
Day_Energy=Day_Energy.sort_values(by=['date','dongho'], axis=0)

Day_Energy=Day_Energy.assign(date=lambda x: x['date'].astype('str'))

t.toc('calculates loading time: ')  # 종료 시간
calculates loading time: 35.181209 seconds.
Day_Energy=Day_Energy.query('date <="2021-07-24"')
Load API data
# Holiday
import requests

def get_request_query(url, operation, params, serviceKey):
    import urllib.parse as urlparse
    params = urlparse.urlencode(params)
    request_query = url + '/' + operation + '?' + params + '&' + 'serviceKey' + '=' + serviceKey+'&_type=json'
    return request_query

t.tic()  # 시작 시간
# 요청 URL과 오퍼레이션
URL = 'http://apis.data.go.kr/B090041/openapi/service/SpcdeInfoService'
OPERATION = 'getRestDeInfo' # 국경일 + 공휴일 정보 조회 오퍼레이션
SERVICEKEY = 'PROVIDED_SERVICE_KEY'# 파라미터

Holiday=pd.DataFrame(columns=['dateKind', 'dateName', 'isHoliday', 'locdate', 'seq'])

for year in range(2018,2022):
    for month in range(1,13):
        if month<10:
            PARAMS = {'solYear':str(year), 'solMonth': '0'+str(month)}
        else:
            PARAMS = {'solYear':str(year), 'solMonth': str(month)}
        request_query = get_request_query(URL, OPERATION, PARAMS, SERVICEKEY)
        html= requests.get(request_query)
        dictr=html.json().get('response').get('body').get('items')

        if dictr !=  '':
            recs = dictr['item']
            from pandas.io.json import json_normalize
            df = json_normalize(recs)
            Holiday=pd.concat([Holiday, df], axis=0)

del(year, month, dictr, recs, df, request_query)

Holiday=Holiday.assign(date= pd.to_datetime(Holiday['locdate'].astype(str), format='%Y-%m-%d')).drop(['dateKind', 'locdate','seq' ], axis=1)
Holiday=Holiday.rename(columns={'dateName' : 'datename','isHoliday' : 'isholiday'})
Holiday=pd.merge(pd.DataFrame(data=pd.date_range(start = '2018-01-01', end ='2021-12-31', freq = 'd'), columns=['date']),
                 Holiday, how='left', left_on='date', right_on='date')
Holiday['isholiday']=Holiday['isholiday'].replace(np.nan, 'N')
Holiday=Holiday.drop(['datename'], axis=1)
Holiday['isholiday'] = Holiday['isholiday'].map({'N':0,'Y':1})
Holiday= Holiday.assign(date=lambda x: x['date'].astype('str'))

t.toc('calculates loading time: ')  # 종료 시간
Holiday.head()
calculates loading time: 13.397597 seconds.
| date | isholiday | |
|---|---|---|
| 0 | 2018-01-01 | 1 |
| 1 | 2018-01-02 | 0 |
| 2 | 2018-01-03 | 0 |
| 3 | 2018-01-04 | 0 |
| 4 | 2018-01-05 | 0 |
# 24 절기
import requests
import pandas as pd

def get_request_query(url, operation, params, serviceKey):
    import urllib.parse as urlparse
    params = urlparse.urlencode(params)
    request_query = url + '/' + operation + '?' + params + '&' + 'serviceKey' + '=' + serviceKey+'&_type=json'
    return request_query

t.tic()  # 시작 시간

# 요청 URL과 오퍼레이션
URL = 'http://apis.data.go.kr/B090041/openapi/service/SpcdeInfoService'
OPERATION = 'get24DivisionsInfo' # 국경일 + 공휴일 정보 조회 오퍼레이션
SERVICEKEY = 'PROVIDED_SERVICE_KEY' # 파라미터

Season=pd.DataFrame(columns=['dateKind', 'dateName', 'isHoliday','kst', 'locdate', 'seq','sunLongitude'])

for year in range(2018,2022):
    for month in range(1,13):
        if month<10:
            PARAMS = {'solYear':str(year), 'solMonth': '0'+str(month)}
        else:
            PARAMS = {'solYear':str(year), 'solMonth': str(month)}
        request_query = get_request_query(URL, OPERATION, PARAMS, SERVICEKEY)
        html= requests.get(request_query)
        dictr=html.json().get('response').get('body').get('items')

        if dictr !=  '':
            recs = dictr['item']
            from pandas.io.json import json_normalize
            df = json_normalize(recs)
            Season=pd.concat([Season, df], axis=0)

del(year, month, dictr, recs, df, request_query)

Season=Season.assign(date= pd.to_datetime(Season['locdate'].astype(str), format='%Y-%m-%d'))\
.drop(['dateKind','isHoliday', 'kst','locdate','seq','sunLongitude' ], axis=1)
Season.head()

Season= pd.DataFrame(Season)
Condition3 = [
    (Season['dateName'].isin(['입춘'])),
    (Season['dateName'].isin(['입하'])),
    (Season['dateName'].isin(['입추'])),
    (Season['dateName'].isin(['입동']))]

values = ['Spring', 'Summer', 'Fall','Winter']
Season['season'] = np.select(Condition3, values)
Season=Season.drop(['dateName'], axis=1)
Season['season']=Season['season'].replace(str(0), np.nan)
Season= Season.dropna()
Season=pd.merge(pd.DataFrame(data=pd.date_range(start = '2018-01-01', end ='2021-12-31', freq = 'd'), columns=['date']),
                Season, how='left', left_on='date', right_on='date')

Season.loc[:,'season']= Season.fillna(method='ffill')
Season.loc[:,'season']= Season.fillna('Winter')
Season= Season.rename(columns={'dateName' : 'datename','sunLongitude' : 'sunlongitude'})
# Season= Season.drop(['sunlongitude'],axis=1)
Season= Season.assign(date=lambda x: x['date'].astype('str'))

t.toc('calculates loading time: ')  # 종료 시간
Season.head()
calculates loading time: 4.834492 seconds.
| date | season | |
|---|---|---|
| 0 | 2018-01-01 | Winter |
| 1 | 2018-01-02 | Winter |
| 2 | 2018-01-03 | Winter |
| 3 | 2018-01-04 | Winter |
| 4 | 2018-01-05 | Winter |
# Data 병합
result= pd.merge(Day_Energy, Holiday, how='left', left_on='date', right_on='date')\
.merge(Season, how='left', left_on='date', right_on='date')
# .merge(Forecast, how='left', left_on='date', right_on='date')

longterm_test= pd.merge(Season, Holiday, how='left', left_on='date', right_on='date')

result.head()
| power | date | week | weekend | dongho | floor | type | isholiday | season | |
|---|---|---|---|---|---|---|---|---|---|
| 0 | 1.10 | 2018-05-01 | Tuesday | 0 | 801-1001 | 10 | 34Py | 0 | Spring |
| 1 | 1.00 | 2018-05-01 | Tuesday | 0 | 801-1002 | 10 | 34Py | 0 | Spring |
| 2 | 4.20 | 2018-05-01 | Tuesday | 0 | 801-1003 | 10 | 34Py | 0 | Spring |
| 3 | 1.00 | 2018-05-01 | Tuesday | 0 | 801-1004 | 10 | 34Py | 0 | Spring |
| 4 | 1.00 | 2018-05-01 | Tuesday | 0 | 801-1101 | 11 | 34Py | 0 | Spring |
# 메모리 정리
del (conn,URL,OPERATION, SERVICEKEY, PARAMS, html, values, Condition1, Condition2, Condition3,
     Day_Energy, Season, Holiday)


gc.collect()
0
Data Preprocessing
결측치 처리
result=result.query('date>="2019-01-01" ').dropna(axis=0)
abnormal=pd.DataFrame(result.loc[result.power<=0].groupby(['dongho']).date.agg(['size']))
abnormal.reset_index(inplace=True)

abnormal['ab_type']=np.where(abnormal['size']<=7,'단기공실','장기공실')
abnormal_list=abnormal.dongho

# 장기 공실 데이터 삭제
result=pd.merge(result, abnormal, how='left', on='dongho')
result=result.loc[result.ab_type!='장기공실'].drop(['size', 'ab_type'], axis=1)
# 단기 공실 데이터 평균으로 대체
result['power']= result.power.replace(0,result.power.mean() )
# 메모리 정리
del (abnormal, abnormal_list)

gc.collect()
12
범주형 변수 one-hot, 연속형 변수 Scaling
# 전처리

t = TicToc()
t.tic()  # 시작 시간

household = result[['date', 'power', 'season', 'isholiday', 'week', 'weekend','type', 'floor', 'dongho']]

week_dummy = pd.get_dummies(household['week'])
household = household.join(week_dummy.add_prefix('week_'))

household['weekend'] = household['weekend'].astype(np.uint8)
household['isholiday'] = household['isholiday'].astype(np.uint8)

type_dummy = pd.get_dummies(household['type'])
household = household.join(type_dummy.add_prefix('type_'))
household['floor'] = household.floor.astype('int')

season_dummy = pd.get_dummies(household['season'])
household = household.join(season_dummy.add_prefix('season_'))

household = household.drop(
    ['week', 'type','season'], axis=1).set_index('date', drop=True)

# 변수형 지정
num_var = list( set([ col for col in household.columns if household[col].dtypes in(['float64']) ]))

# scale 저장
# scaler = MinMaxScaler().fit(household[num_var])
# joblib.dump(scaler, 'scaler.pkl')
scaler = joblib.load("scaler.pkl")

household[num_var] = scaler.transform(household[num_var])
household[num_var] = np.where(household[num_var] < 0, 0, household[num_var])

household['floor']= household['floor'].astype(np.int32)
household[num_var]= household[num_var].astype(np.float32).round(4)


forecast_horizon = 30
df_list = []  # 리스트 초기화
for dongho, group_data in household.groupby('dongho'):

    group_data['dongho'] = np.repeat(dongho, len(group_data))

    for i in range(1, forecast_horizon+1, 1):
        group_data['power_lag' + str(i)] = group_data.power.shift(i)

    group_data = group_data.dropna(axis=0)
    df_list.append(group_data)  # 리스트에 담아준다

household = pd.concat(df_list)

t.toc('calculates preprocessing time: ')  # 종료 시간
calculates preprocessing time: 19.029327 seconds.
Train or Load Model
Linear Model
t = TicToc()
t.tic()  # 시작 시간
# 모델 학습 및 저장: Linear_model
# linear_model = LinearRegression(fit_intercept=True).fit(
#     household.drop(['power', 'dongho'], axis=1), y=household.power)
# joblib.dump(linear_model, 'linear_model.pkl')

linear_model = joblib.load("linear_model.pkl")
t.toc('calculates fitting time: ')  # 종료 시간
calculates fitting time: 0.000642 seconds.
Random Forest
t.tic()  # 시작 시간
# 모델 학습 및 저장: rf_model
# param_grid = {'n_estimators': np.arange(2, 20, 2), 'bootstrap': [True, False], 'max_features': np.arange(2, 14, 2),
#               'max_depth': np.arange(2, 14, 2), 'random_state': [2]}
# rf_model = GridSearchCV(RandomForestRegressor(), param_grid=param_grid,
#                                refit=True).fit(household.drop(['power', 'dongho'], axis=1), y=household.power)
# print('rf best parameter:', rf_model.best_params_,
#       'best score:', rf_model.best_score_.round(2))
# joblib.dump(rf_model, 'rf_model.pkl')

rf_model = joblib.load("rf_model.pkl")
t.toc('calculates fitting time: ')  # 종료 시간
calculates fitting time: 0.018461 seconds.
XGBoost
t.tic()  # 시작 시간
# 모델 학습 및 저장: xgb_model
# param_grid = {'eta': np.arange(0.1, 1, 0.1), 'max_depth': np.arange(
#     1, 20, 1), 'random_state': [2]}
# xgb_model = GridSearchCV(XGBRegressor(objective='reg:squarederror'), param_grid=param_grid,
#                                 refit=True).fit(household.drop(['power', 'dongho'], axis=1), y=household.power)
# print('xgb best parameter:', xgb_model.best_params_,
#       'best score:', xgb_model.best_score_.round(2))
# joblib.dump(xgb_model, 'xgb_model.pkl')

xgb_model = joblib.load("xgb_model.pkl")
t.toc('calculates fitting time: ')  # 종료 시간
calculates fitting time: 0.356841 seconds.
LGBMRegressor
t.tic()  # 시작 시간
# 모델 학습 및 저장: lgb_model
# param_grid = {'learning_rate': np.arange(
#     0.1, 1, 0.1), 'max_depth': np.arange(1, 20, 1), 'random_state': [2]}
# lgb_model = GridSearchCV(LGBMRegressor(), param_grid=param_grid,
#                          refit=True).fit(household.drop(['power', 'dongho'], axis=1), y=household.power)
# print('lgb best parameter:', lgb_model.best_params_,
#       'best score:', lgb_model.best_score_.round(2))
# joblib.dump(lgb_model, 'lgb_model.pkl')

lgb_model = joblib.load("lgb_model.pkl")
t.toc('calculates fitting time: ')  # 종료 시간
calculates fitting time: 0.006973 seconds.
Model Validation
#validation
household['linear_fitted'] = linear_model.predict(household.drop(['power','dongho'],axis=1))
household['rf_fitted'] = rf_model.predict(household.drop(['power','dongho','linear_fitted'],axis=1))
household['xgb_fitted'] = xgb_model.predict(household.drop(['power','dongho','linear_fitted','rf_fitted'],axis=1))
household['lgb_fitted'] = lgb_model.predict(household.drop(['power','dongho','linear_fitted','rf_fitted','xgb_fitted'],axis=1))
household= household[['power', 'linear_fitted','rf_fitted','xgb_fitted','lgb_fitted', 'dongho']]

household = household.assign(linear_fitted= lambda x: (x['linear_fitted']*(scaler.data_max_[0]-scaler.data_min_[0]))+scaler.data_min_[0],
                             rf_fitted= lambda x: (x['rf_fitted']*(scaler.data_max_[0]-scaler.data_min_[0]))+scaler.data_min_[0],
                             xgb_fitted= lambda x: (x['xgb_fitted']*(scaler.data_max_[0]-scaler.data_min_[0]))+scaler.data_min_[0],
                             lgb_fitted= lambda x: (x['lgb_fitted']*(scaler.data_max_[0]-scaler.data_min_[0]))+scaler.data_min_[0],
                             power= lambda x: (x['power']*(scaler.data_max_[0]-scaler.data_min_[0]))+scaler.data_min_[0])
from sklearn.metrics import make_scorer, r2_score, mean_absolute_error, mean_squared_error, mean_squared_log_error

def precision(data,name,predict,origin):
    MAE = mean_absolute_error(data[origin],data[predict]).round(2)
    RMSE = np.sqrt(mean_squared_error(data[origin],data[predict])).round(2)
    CV_RMSE= 100*((np.sqrt(mean_squared_error(data[origin],data[predict]))/np.mean(data[origin])).round(2))
    MAPE = round(np.nanmean((abs(data[origin]-data[predict]))/(data[origin]))*100,2)
    MAPE_adjust = round(np.mean((abs(data[origin]-data[predict]))/(data[origin]+1))*100,2)
    Max_AE = round(np.max(abs(data[origin]-data[predict])),2)
    Max_APE = round(np.nanmax(abs(data[origin]-data[predict])/data[origin])*100,2)
    dict=pd.DataFrame({'Model':name,'MAE': MAE, 'RMSE':RMSE, 'CV_RMSE':CV_RMSE, \
                       'MAPE': MAPE, 'MAPE_adjust': MAPE_adjust, 'Max_AE': Max_AE, 'Max_APE': Max_APE}.items()).transpose().drop(0)
    dict.columns=['Model','MAE', 'RMSE', 'CV_RMSE', 'MAPE', 'MAPE_adjust','Max_AE','Max_APE']
    return(dict)

def func(x):
    d = {}
    d['MAPE_mean'] = x['MAPE'].mean().round(2)
    d['MAPE_std'] = x['MAPE'].std().round(2)
    d['MAPE_max'] = x['MAPE'].max()
    d['MAPE_min'] = x['MAPE'].min()
    d['MAPE_range'] = x['MAPE'].max() - x['MAPE'].min()
    return pd.Series(d, index=['MAPE_mean', 'MAPE_std', 'MAPE_max', 'MAPE_min', 'MAPE_range'])
eval_list = [] ## 리스트 초기화
dongho_list=[]
for dongho, group_data in household.groupby('dongho'):
    dongho_list.append(dongho)
    eval_list.append(precision(group_data.loc[group_data.power>1], 'linear','linear_fitted','power'))
    dongho_list.append(dongho)
    eval_list.append(precision(group_data.loc[group_data.power>1], 'rf','rf_fitted','power'))
    dongho_list.append(dongho)
    eval_list.append(precision(group_data.loc[group_data.power>1], 'xgb','xgb_fitted','power'))
    dongho_list.append(dongho)
    eval_list.append(precision(group_data.loc[group_data.power>1], 'lgb','lgb_fitted','power'))


Evaluation= pd.concat(eval_list)
Evaluation['dongho']=dongho_list
t.toc('calculates evaluating time: ') # 종료 시간
Evaluation
calculates evaluating time: 173.691505 seconds.
| Model | MAE | RMSE | CV_RMSE | MAPE | MAPE_adjust | Max_AE | Max_APE | dongho | |
|---|---|---|---|---|---|---|---|---|---|
| 1 | linear | 1.39 | 1.98 | 32.00 | 23.04 | 19.33 | 13.60 | 140.75 | 801-1001 |
| 1 | rf | 1.38 | 1.93 | 31.00 | 23.28 | 19.46 | 13.83 | 149.06 | 801-1001 |
| 1 | xgb | 1.30 | 1.86 | 30.00 | 21.76 | 18.24 | 10.60 | 157.67 | 801-1001 |
| 1 | lgb | 1.34 | 1.93 | 31.00 | 22.48 | 18.83 | 13.23 | 152.97 | 801-1001 |
| 1 | linear | 1.36 | 1.78 | 19.00 | 15.76 | 13.98 | 8.89 | 127.15 | 801-1002 |
| ... | ... | ... | ... | ... | ... | ... | ... | ... | ... |
| 1 | lgb | 2.60 | 3.42 | 23.00 | 20.00 | 18.28 | 13.68 | 274.00 | 811-101 |
| 1 | linear | 4.66 | 6.32 | 31.00 | 44.52 | 37.54 | 30.43 | 747.50 | 812-101 |
| 1 | rf | 2.76 | 3.75 | 19.00 | 20.25 | 17.70 | 16.06 | 380.99 | 812-101 |
| 1 | xgb | 2.11 | 2.98 | 15.00 | 15.21 | 13.42 | 13.90 | 307.81 | 812-101 |
| 1 | lgb | 3.20 | 4.45 | 22.00 | 23.06 | 20.27 | 19.04 | 476.35 | 812-101 |
4708 rows × 9 columns
Evaluation.groupby(['Model']).apply(func)
| MAPE_mean | MAPE_std | MAPE_max | MAPE_min | MAPE_range | |
|---|---|---|---|---|---|
| Model | |||||
| lgb | 17.19 | 5.12 | 45.37 | 6.72 | 38.65 |
| linear | 17.96 | 5.58 | 61.39 | 6.79 | 54.60 |
| rf | 17.14 | 4.98 | 41.65 | 6.52 | 35.13 |
| xgb | 16.54 | 4.66 | 37.90 | 6.53 | 31.37 |
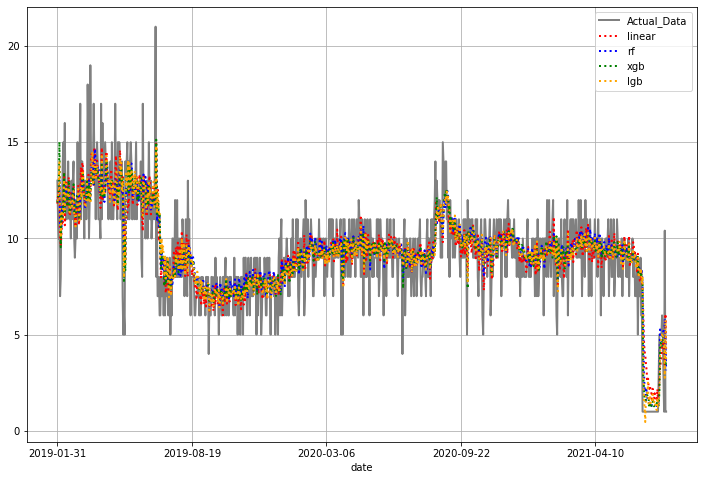
import matplotlib.pyplot as plt
plt.rcParams["figure.figsize"] = (12, 8)
plt.rcParams['lines.linewidth'] = 2
plt.rcParams['lines.color'] = 'r'
plt.rcParams['axes.grid'] = True

pd.plotting.register_matplotlib_converters()
household.loc[household.dongho=="801-1002"].power.plot(figsize=(12,8),color="gray", legend=True, label="Actual_Data")
household.loc[household.dongho=="801-1002"].linear_fitted.plot(style=":",color="red", legend=True, label="linear")
household.loc[household.dongho=="801-1002"].rf_fitted.plot(style=":",color="blue", legend=True, label="rf")
household.loc[household.dongho=="801-1002"].xgb_fitted.plot(style=":",color="green", legend=True, label="xgb")
household.loc[household.dongho=="801-1002"].lgb_fitted.plot(style=":",color="orange", legend=True, label="lgb")
<AxesSubplot:xlabel='date'>